Let’s be honest, it’s tough to be on the data team. You stand behind the counter in the “data kitchen,” dishing out cleaned and modeled data to an army of internal stakeholders, like marketing, who’ve been standing in the “data bread line” for weeks or months.
You’re building pipelines, debugging flaky ETL, reconciling drift, chasing schema changes, onboarding new sources, and fielding last-minute requests like, “hey can you join this meeting and explain why our campaign funnel looks wrong?” Meanwhile, internal customers wait for metrics, stalling on decisions while dashboards or queries materialize. Or worse, trusting opaque numbers that are essentially educated guesses.
So, how can this cycle be fixed?
With visual tools and a composable data infrastructure that makes clarity, context, and collaboration easier. That’s what we’ve built with our newest feature, Data Manager.
A visual canvas is the next frontier
Most people think better with visual context or images, so if your data schemas, lineage maps, and model logic are only written down in text format, you’re at a disadvantage. It’s likely that internal stakeholders will struggle to understand what it means when you mention a table join or a filter, without a visual diagram or flow chart for context. New data team members will also take longer to onboard and understand the data schema, leading to delays in delivering on data requests and lost time.
However, visualizing data relationships and lineage makes abstract data tables easier to understand for everyone, which directly leads to stronger communication and collaboration between teams.
The hidden burden of data management
Let’s imagine a particular problem, one that will sound quite familiar. Marketing is running a new campaign and wants to use a custom CRM field “stakeholder_score_v2.” They ask the data team: “Can you join that field and refresh it daily for the most up-to-date data?”
The request goes back and forth in Slack, Teams, or ticketing. The data team asks clarifying questions like which table, which column, what’s the logic, what’s the join key, and so on. Two weeks later, the data is delivered, but something is off and no one knows exactly what. Sound familiar?
Composable CDPs are powerful, but they put more responsibility on the data team to be thoughtful and strategic about how they structure and connect data in their warehouse. When data teams work with complex relationships in their warehouse, they might not initially know how certain data tables are connected to each other. In order to understand those connections, data teams write complex SQL queries, inspect the metadata, and document their findings to not only understand, but also to explain their data schema—all in text and SQL queries.
Warehouses only reveal data connections in tables and lists. Data teams are left digging through documentation or trying to keep a mental model of their entire data ecosystem just to understand how datasets fit together. As models grow, SQL queries become increasingly complex, making it difficult to add related tables, modify existing relationships, or understand join logic at a glance.
Without a visual representation, data teams can’t easily see how changes in one dataset may impact others, break relationships, or affect downstream audiences and journeys. New data team members have to sift through complex documents to understand basic data relationships. As for the marketing team, understanding the data schema becomes a black box, especially without context or knowledge of SQL which slows everyone down and creates unnecessary overhead.
This complexity becomes even more painful as dataset groups grow, real-time events are introduced, and user traits or computed fields need to be added or modified, which are all areas where SQL logic can become brittle and error-prone. Without visibility into how datasets are actually used across audiences and journeys, data teams struggle to prioritize decisions.
What if you could make your data schema more accessible to marketing, while also preserving governance?
This is precisely where, Data Manager comes in.
Introducing Data Manager: An intuitive, visual canvas for data modeling
Data Manager brings a visual, intuitive UI to data modeling, making it simple for data teams to view, connect, and manage datasets all in one canvas. No more guesswork or documentation sprawl, just a single visual map that accelerates onboarding, ensures data accuracy, and lays the foundation for self-serve marketing activation.
With Data Manager you get:
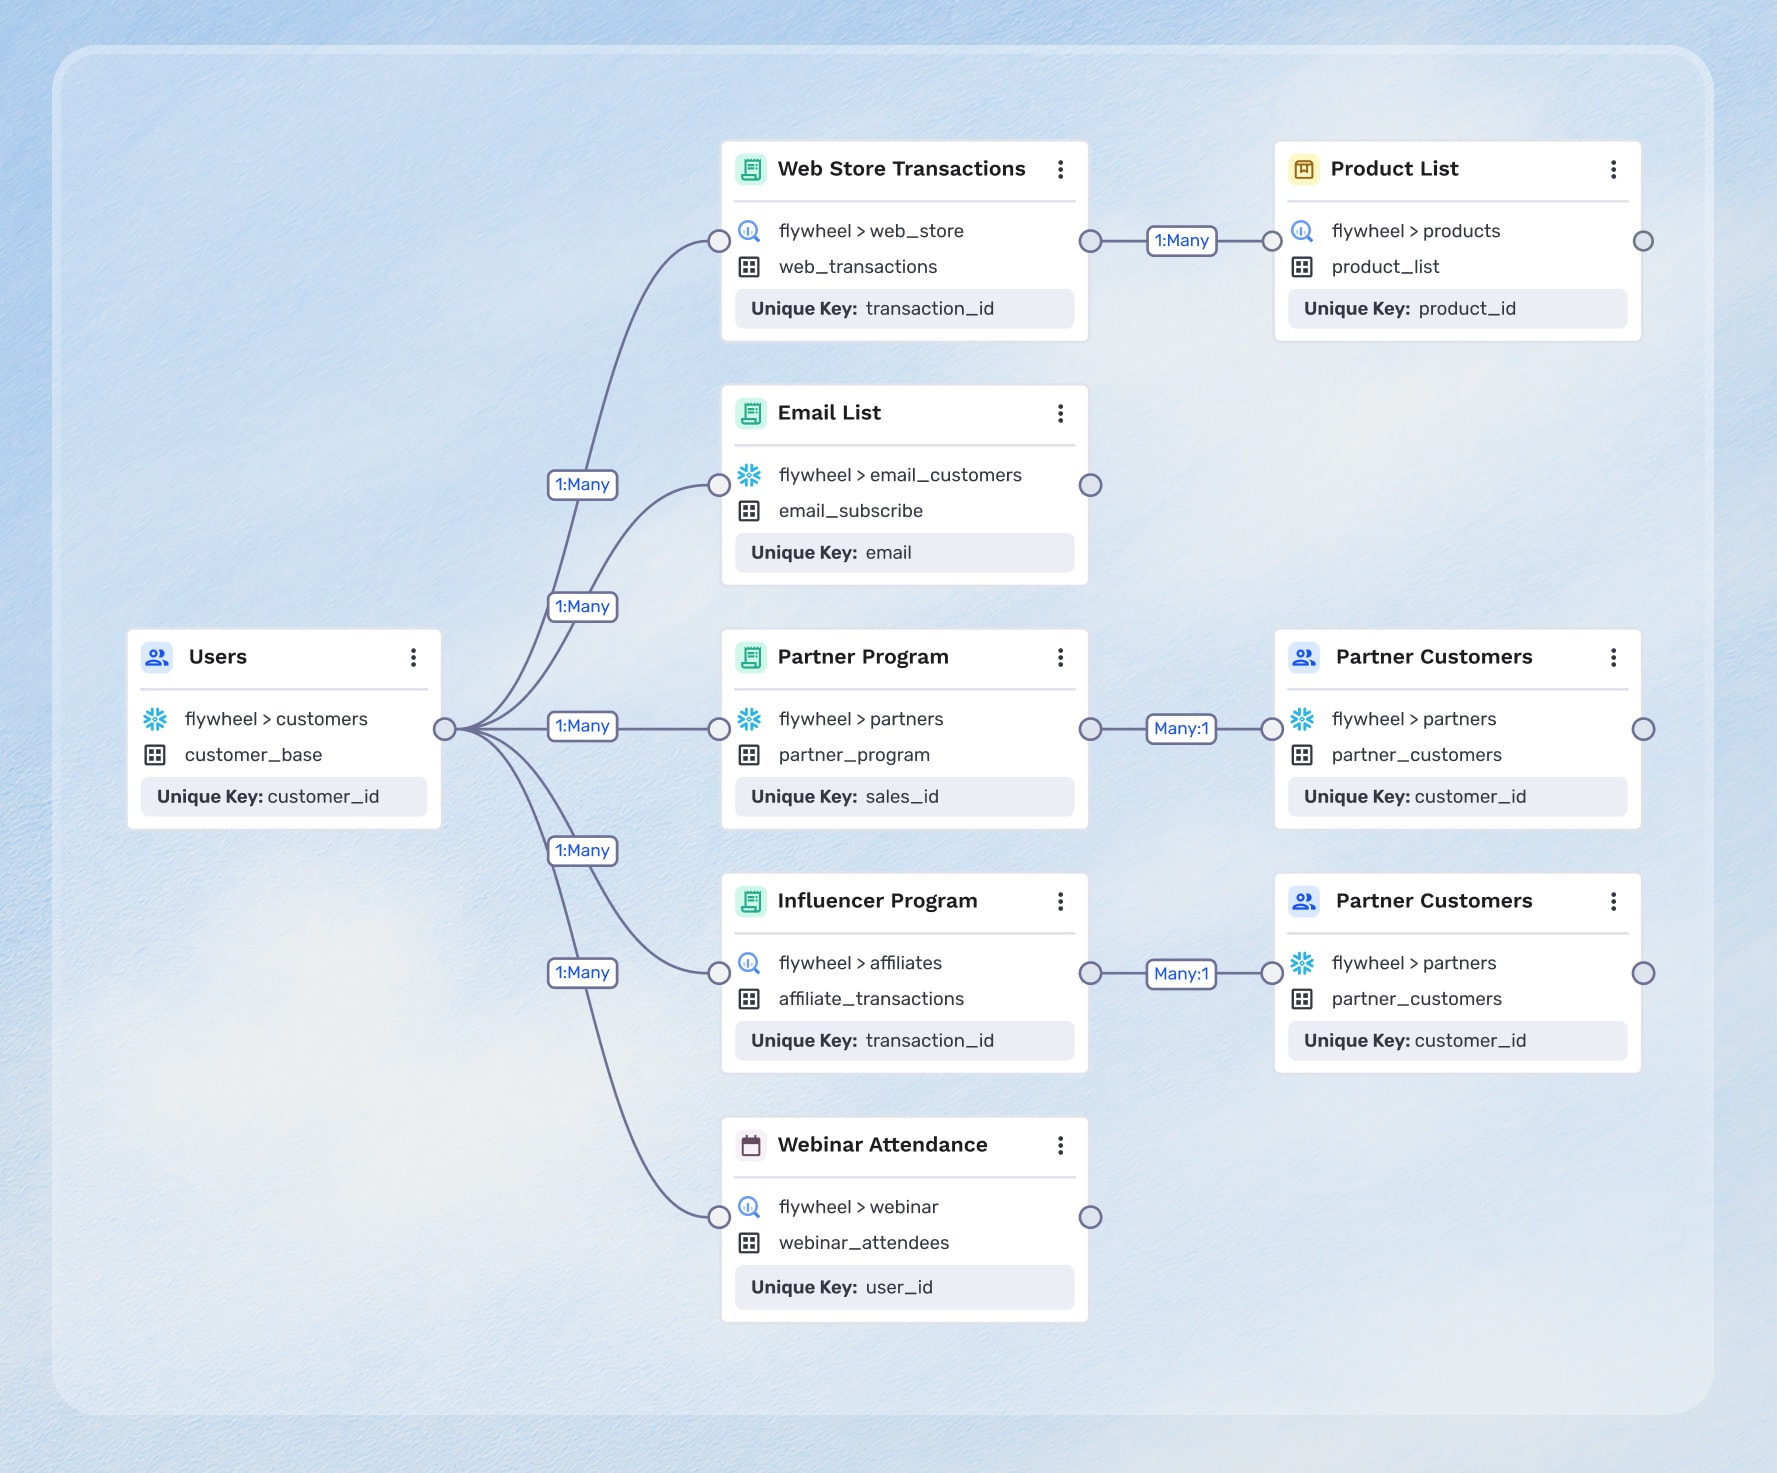
Your schema at a glance, all in one canvas
Data Manager gives you a live, interactive view of your data sources, how they connect, how they map into the warehouse, and how those data sources feed audience definitions and downstream models.
Forget your stale PowerPoint sketches or out-of-sync Confluence diagrams. With the schema in one governed canvas, you reduce overhead for data teams, giving them time to focus on data strategy instead of maintenance.
Faster data onboarding and source integration
Onboard and modify data in minutes with an intuitive, visual interface that reduces downstream schema and sync errors. Map fields, define transformations, understand overlapping domains, all with immediate feedback, making it easier to orient new data sources and contributors. Stakeholders no longer need to wait weeks for simple schema changes, accelerating experimentation and campaign execution.
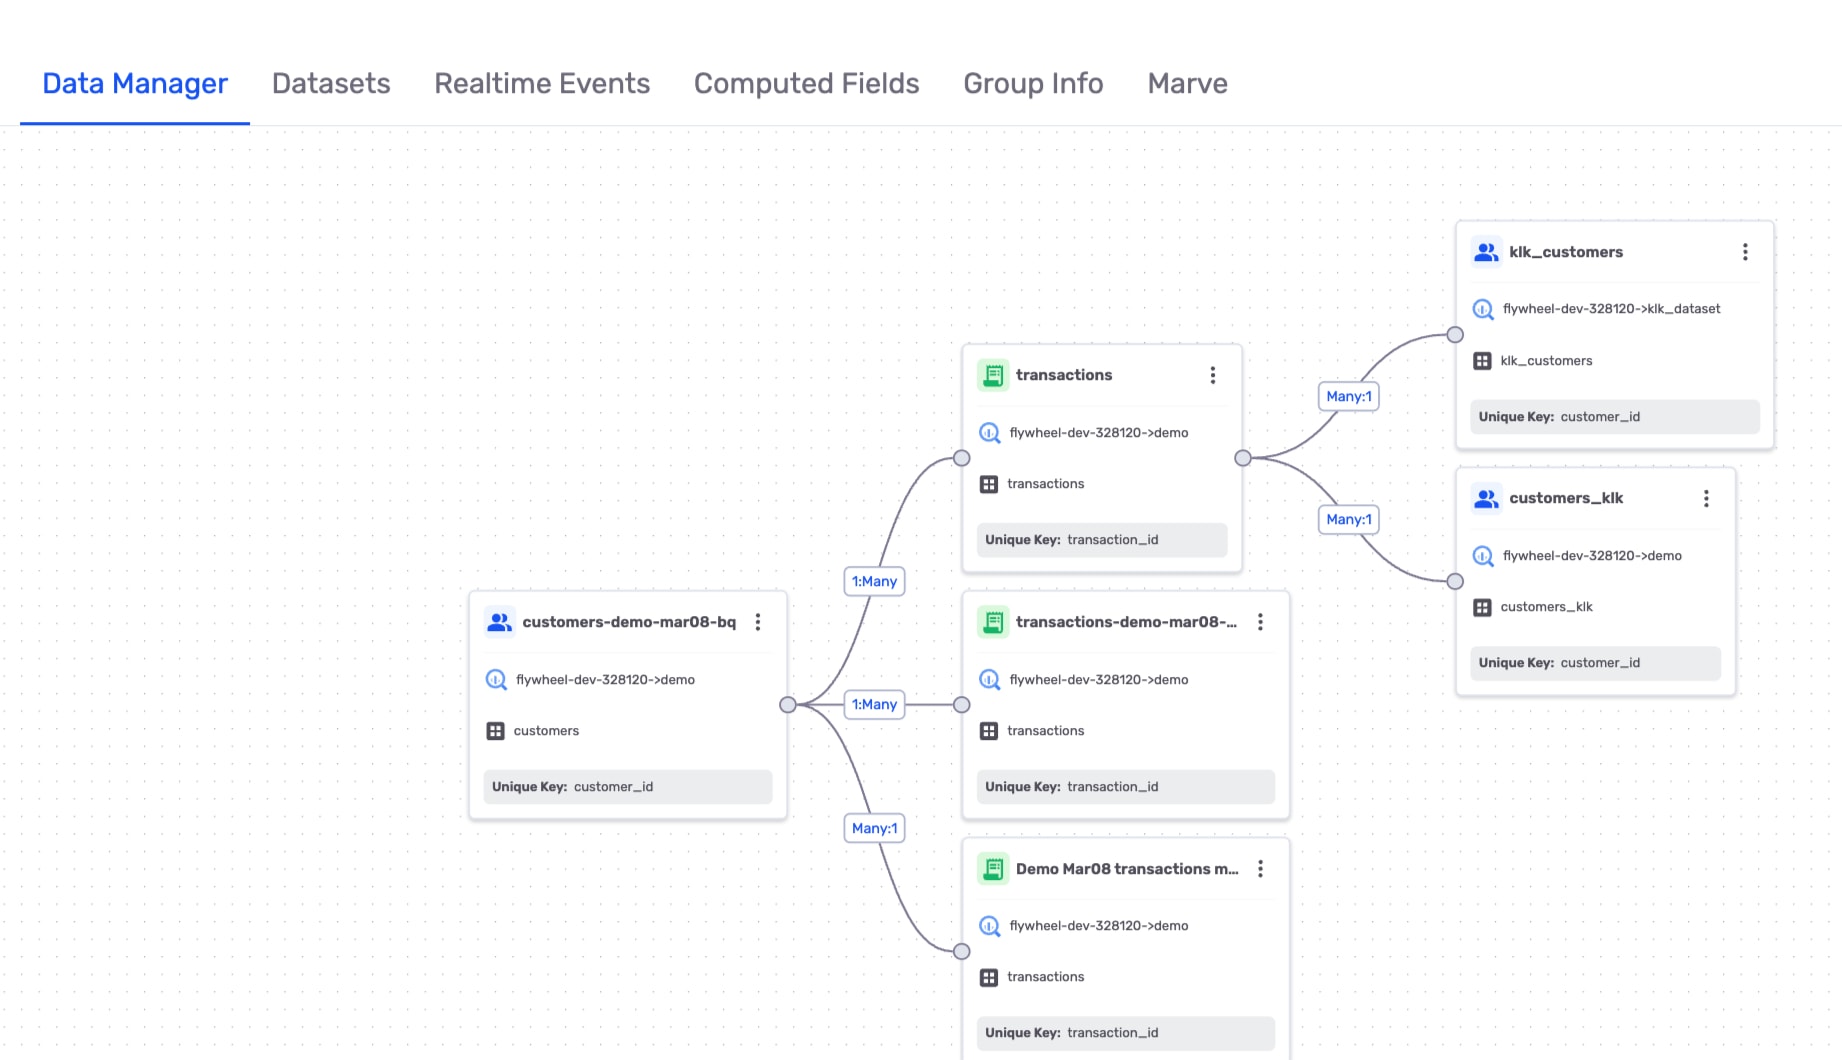
Now, you can:
Click a button to add a new or existing dataset directly to a primary node anchored to a data table, and it will show up immediately on the Data Manager canvas.
Add a computed field (user trait), like average transaction value, to the primary table with one click in the canvas.
If you’re using Real-time Messaging to deliver marketing campaigns the instant a user qualifies, you can add a real-time event to immediately visualize and understand how existing behavioral data relates to the datasets.
Better collaboration between data and internal stakeholders
With a shared visual layer, internal stakeholders can see what the data is, how it’s shaped, where it came from, and how it’s used. Everyone sees the same picture of the schema, which creates a common language and shared mental model that builds trust and collaboration. It also reduces redundant tickets, all while the data team retains governance.
And this is just the start
Data Manager will soon offer more capabilities and benefits for the data team. In the future, you will be able to:
Never miss a sync with better real-time observability
Stop digging around to determine if sync 17 out of 985 made it to the destination. If there’s an issue, we’ll alert you with all the information you need to know, such as why the sync failure happened, and at what step it failed.
Empower other teams to understand your schema with safe editing
Marketers and other internal stakeholders can use Data Manager to explore schema, propose additions, or suggest transformations completely self-service and without the data team. This increased visibility not only empowers marketers and internal stakeholders, but it also makes your schema a shared space for everyone to understand while the data team retains governance and version control.
Bridge the gap between data and marketing with GrowthLoop
Data teams and internal stakeholders want clarity, confidence, and control. But until now, schema complexity and communication gaps have kept everyone waiting in the same data bread line.
Data Manager provides data teams with visibility, context, and governance in one visual canvas without offloading responsibility. And it gives marketers and internal stakeholders a seat at the table, transforming the bread line into an abundant buffet.
Only GrowthLoop delivers a warehouse-native, canvas-based data management experience, built directly on the data cloud and made to help you compound growth.
If you'd like to learn more, please reach out to us for a demo.
Related resources
More from the GrowthLoop blog
 Marketing
Why marketing experiments fail and how causal data delivers clarity and confidence
Learn why most marketers struggle with campaign testing and what successful teams are doing differently based on industry research.
 AI
AIThe agentic marketing trap: Why scaling correlations is not the same as driving outcomes
AI agents are great at spotting correlations, but not causation. Learn why agentic marketing must be grounded in causal reasoning to drive real growth.
 Marketing
New research: Marketing’s AI era has a data problem
Get the latest research from the 2026 AI and Marketing Performance Index, a data-driven study on how best-in-class marketing teams operate.